Plotting
Plotting an MFILE
Note
The majority of the output plots can be automatically generated at the end of the PROCESS run by using the --full-output flag.
See the running process section for more info.
Summary document
plot summary is used for plotting an overview of the results from an MFILE. It can be run using its own CLI (see here for full details):
process plot summary -f path/to/MFILE.DAT
or through PROCESS's main CLI:
process -i path/to/IN.DAT --full-output
An example of a plot summary output PDF for the large tokamak regression test is shown below:
Scan files
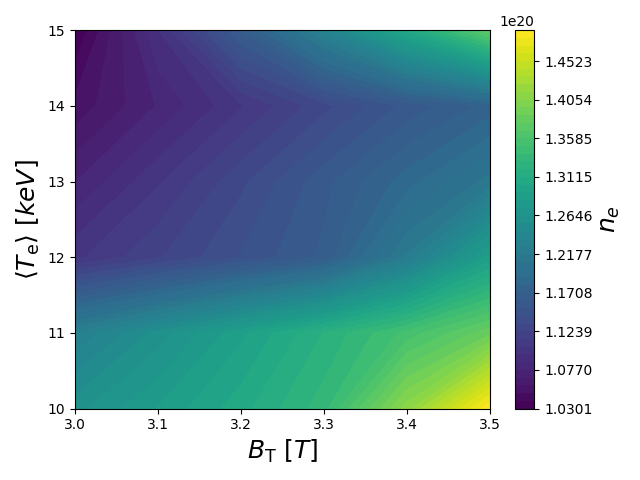
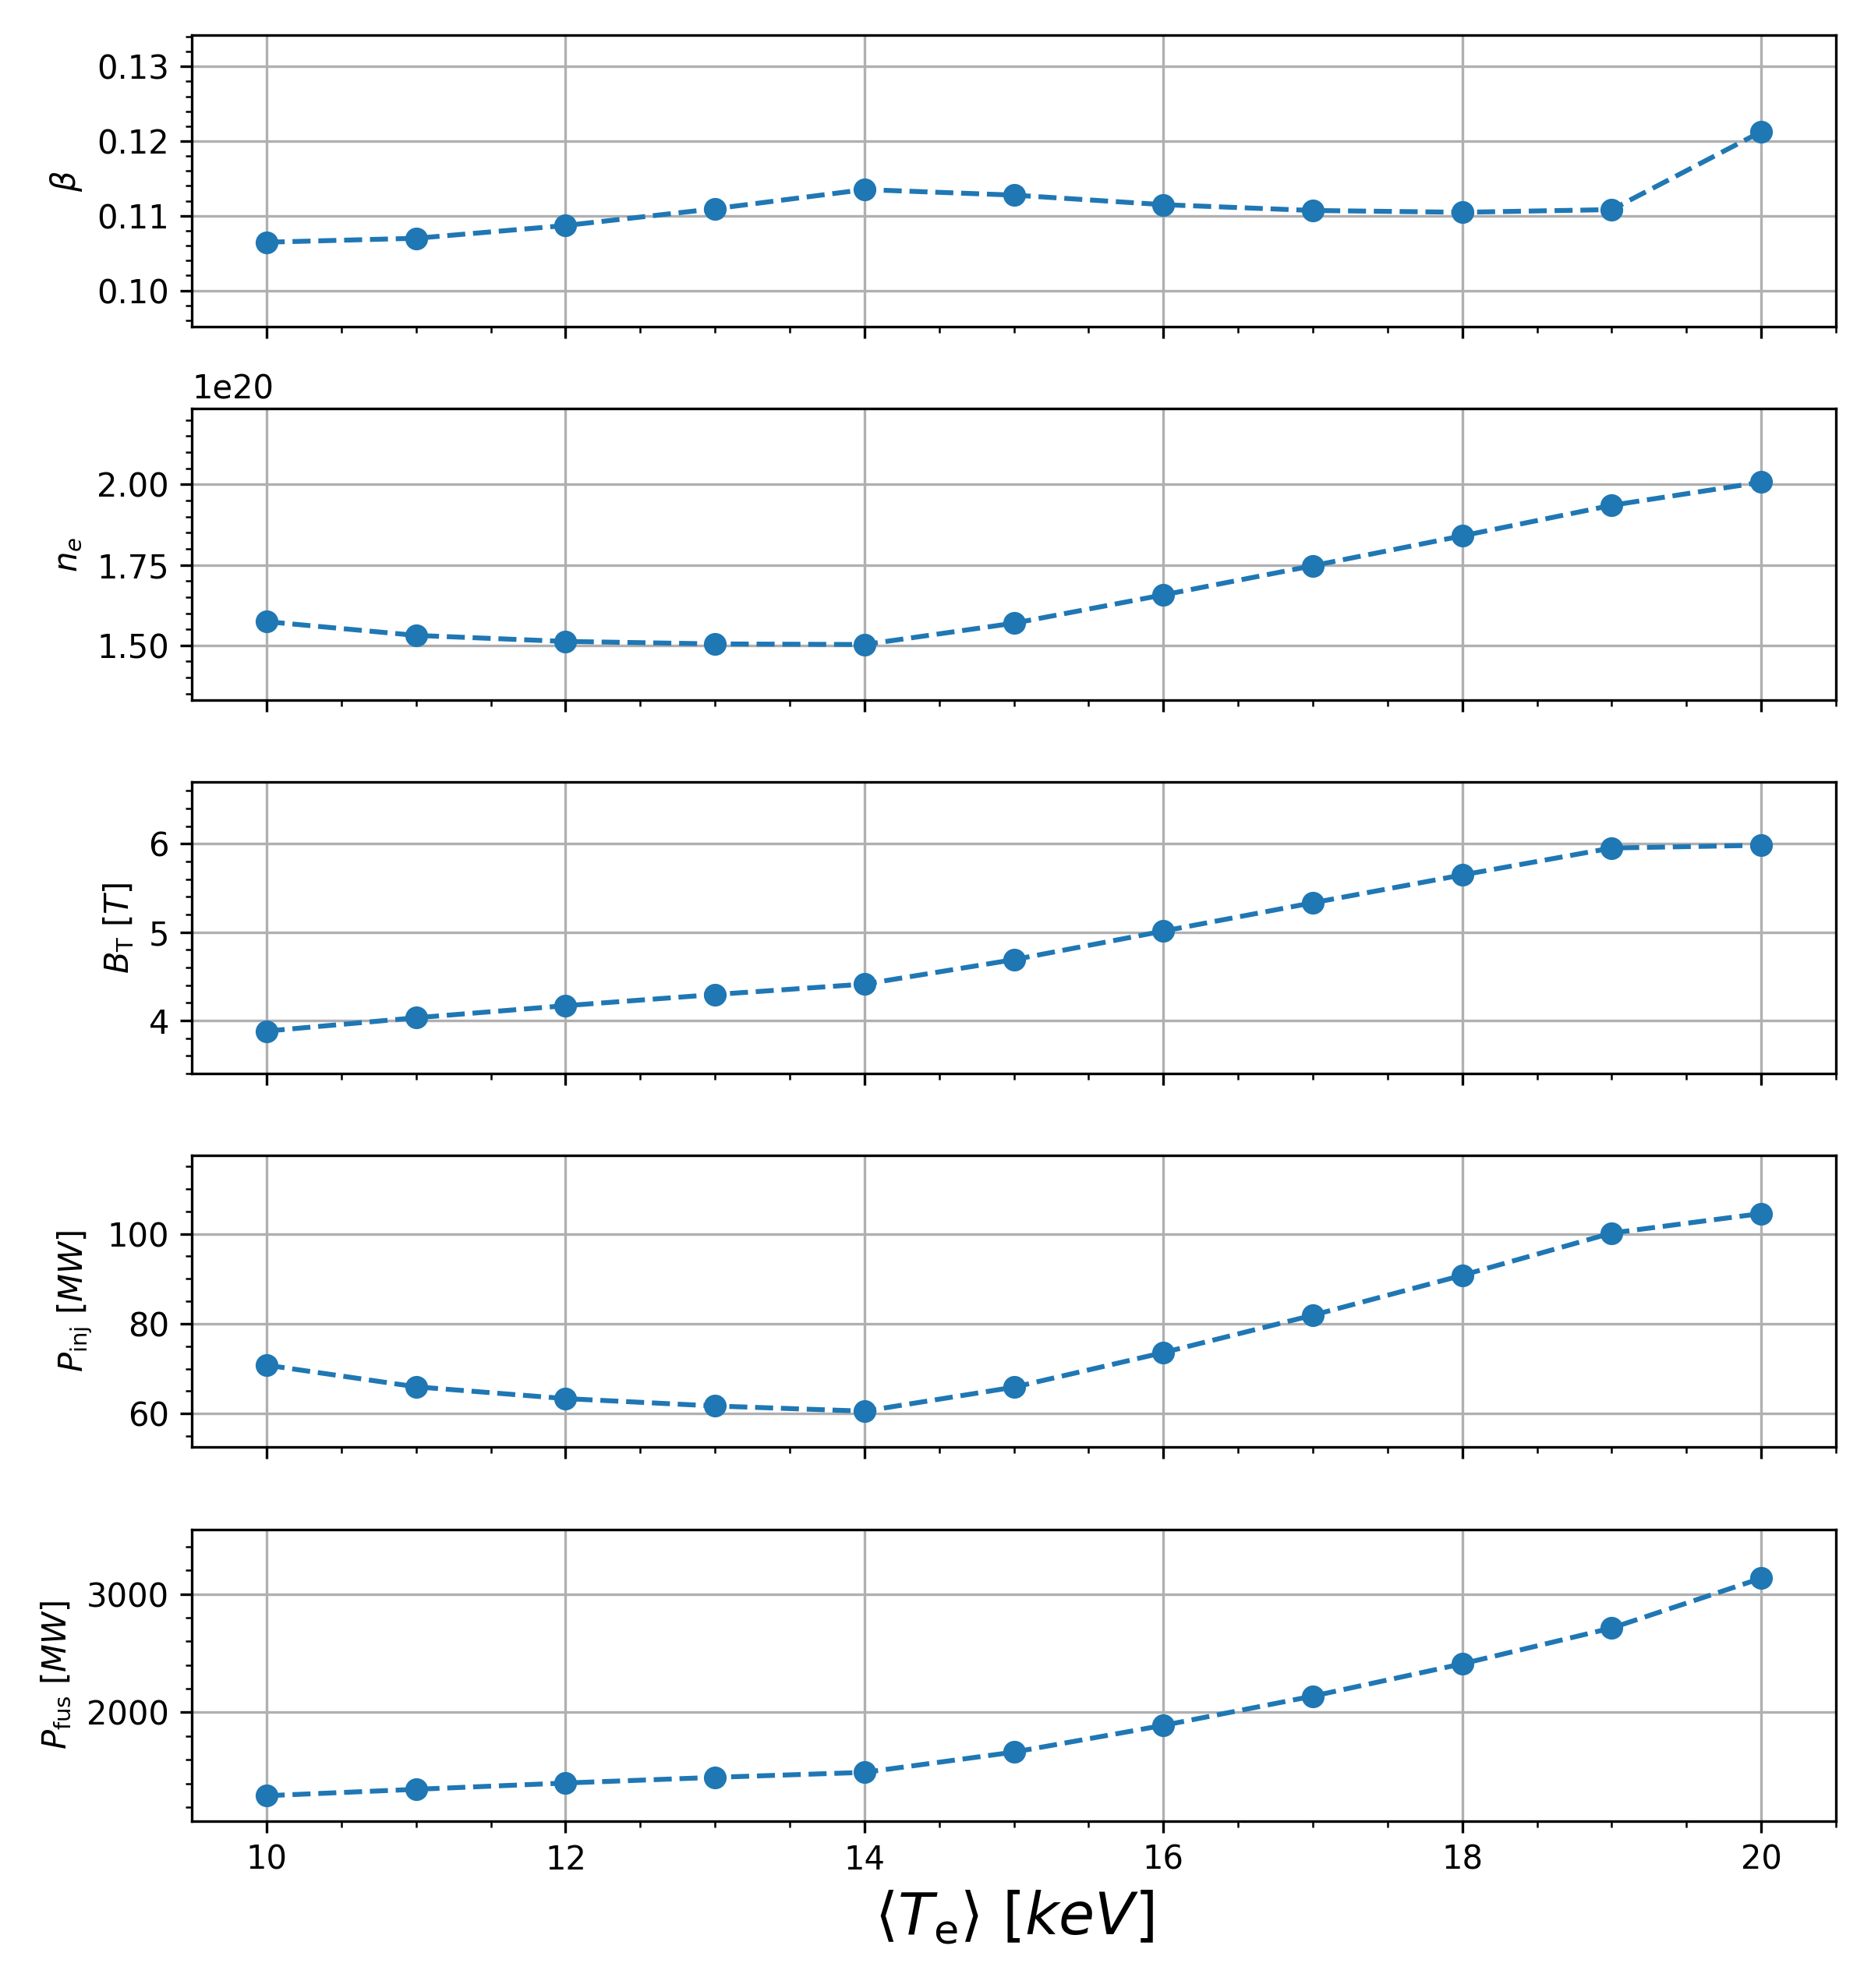
plot_scans is a tool to show the change in variables as a scan variable is varied.
Scans can be done in one or two dimensions.
process plot scans -f path/to/MFILE.DAT
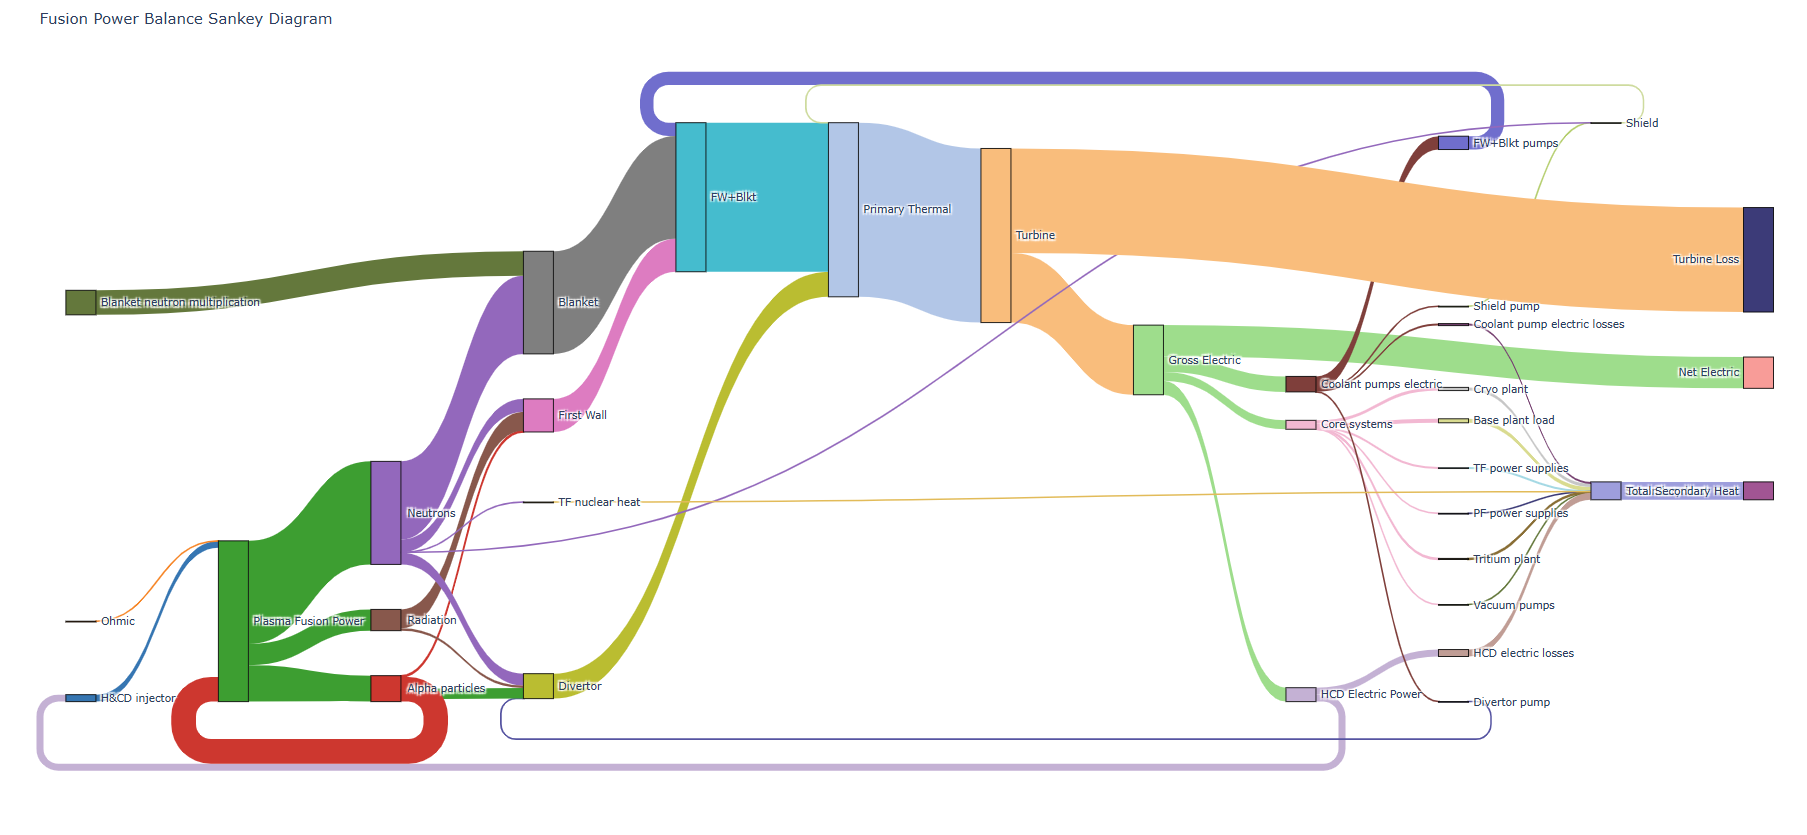
Interactive Sankey diagram
plot_plotly_sankey is to plot an interactive .html Sankey diagram for looking at the plants power balance. It can be run as follows:
process plot sankey -m path/to/MFILE.DAT --format html